In the latest instalment of our ongoing series detailing the metrics of the Swarm network, we delve into data from February. This comprehensive overview provides the Swarm community with a clear picture of the network’s performance, including key statistics such as total monthly rewards, median and average win values, monthly earnings for active staking nodes, and the geographical distribution of these nodes. February’s data reveals the continuation of existing trends and subtle shifts in network activity, rewards distribution, and global participation. By examining these metrics, we aim to offer a thorough understanding of the Swarm network’s current state and continuing evolution.
Network Total Monthly Rewards
This metric shows the total rewards paid out across the entire network for each month.
| Month | Total Network Rewards (xBZZ) |
|---|---|
| September | 147,825 |
| October | 152,868 |
| November | 148,617 |
| December | 159,865 |
| January | 157,596 |
| February | 152,974 |
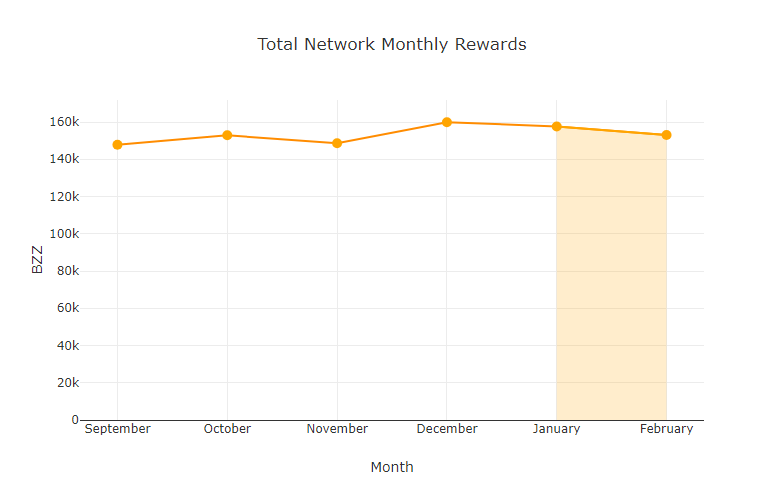
In February, a total of 152,974 xBZZ were issued in rewards to node operators. This represents a slight decrease from January’s figure of 157,596 xBZZ, suggesting a minor adjustment in network activity.
Monthly Median Win Values
This metric is the median win amount for each win event.
| Month | Median Win Values (xBZZ) |
|---|---|
| September | 44.62 |
| October | 46.84 |
| November | 46.83 |
| December | 48.06 |
| January | 47.43 |
| February | 49.15 |
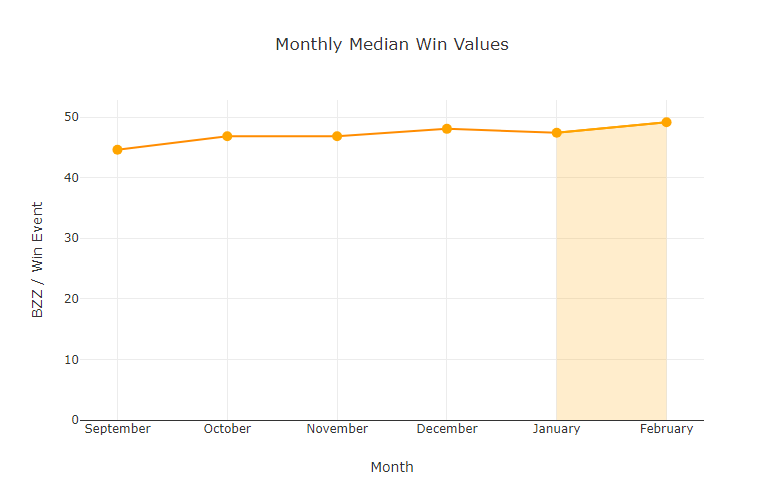
February saw the median win value increase to 49.15 xBZZ, up from January’s 47.43 xBZZ, indicating slightly higher reward values for winning nodes.
Monthly Average Win Values
This metric is the average win amount for each win event.
| Month | Average Win Values (xBZZ) |
|---|---|
| September | 46.52 |
| October | 62.09 |
| November | 47.41 |
| December | 57.75 |
| January | 51.20 |
| February | 54.42 |
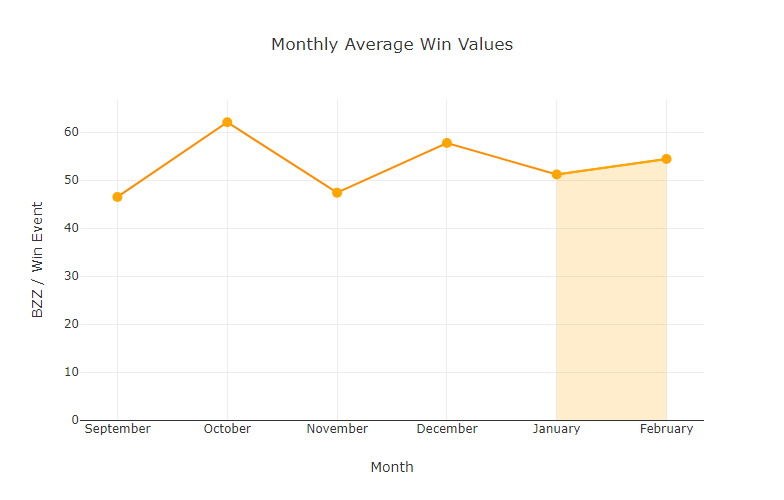
The average win value in February adjusted to 54.42 xBZZ, demonstrating an increase from January’s 51.20 xBZZ.
Active Staking Node Monthly Average Earnings
This metric shows the average monthly earnings for an active staking node.
| Month | Avg Total Earnings per Node (xBZZ) |
|---|---|
| September | 32.31 |
| October | 14.73 |
| November | 8.12 |
| December | 12.40 |
| January | 13.89 |
| February | 13.21 |
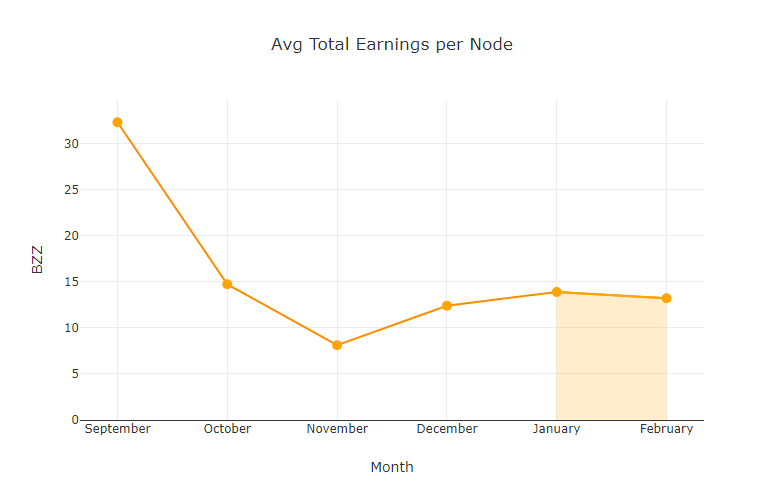
The average earnings per active staking node saw a slight decrease to 13.21 xBZZ in February from January’s 13.89 xBZZ.
Total Active Staking Nodes by Month
This metric shows the total active staking nodes by month.
| Month | Total Active Staking Nodes |
|---|---|
| September | 4,574 |
| October | 10,367 |
| November | 20,868 |
| December | 12,891 |
| January | 11,350 |
| February | 11,576 |
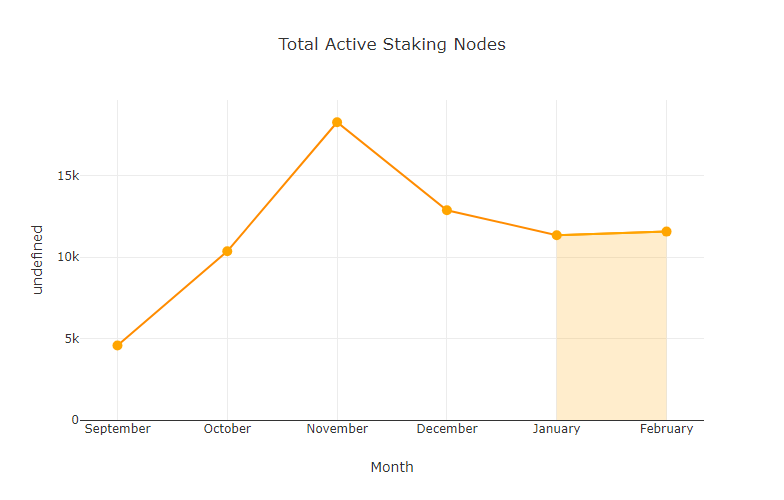
The total number of active staking nodes slightly increased to 11,576 in February from January’s 11,350.
Total Winning Nodes by Month
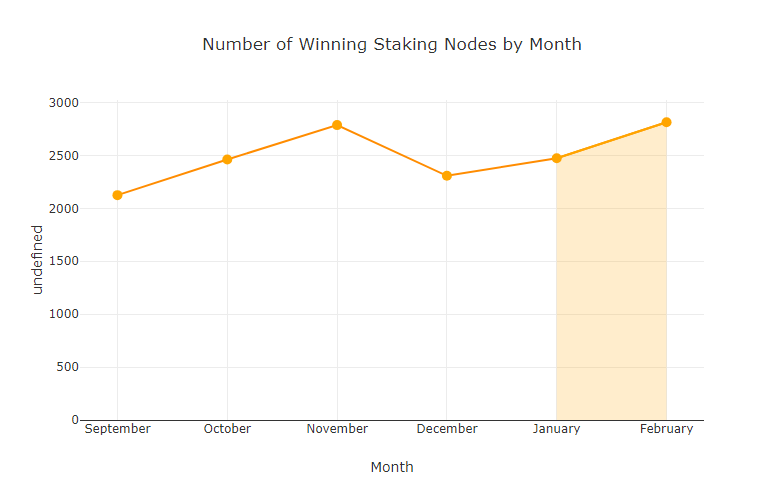
This metric shows the total number of unique active staking nodes which have won at least once within the month.
| Month | Total Winning Nodes |
|---|---|
| September | 2,125 |
| October | 2,462 |
| November | 2,787 |
| December | 2,308 |
| January | 2,474 |
| February | 2,814 |
February observed an increase in the total number of winning nodes to 2,814 from January’s 2,474.
Total Active Staking Nodes by Country
This metric shows the total number of active staking nodes across the top four countries and all other countries aggregated into the “Other” category, as well as the remaining nodes in the “Unknown” category.
| China | Germany | Finland | Unknown | United States | Other | |
|---|---|---|---|---|---|---|
| September | 574 | 2,046 | 1,607 | 217 | 8 | 123 |
| October | 6,242 | 2,042 | 1,543 | 175 | 282 | 91 |
| November | 16,145 | 2,225 | 1,961 | 37 | 363 | 137 |
| December | 8,333 | 2,001 | 1,919 | 265 | 312 | 61 |
| January | 6,696 | 1,937 | 1,769 | 701 | 181 | 66 |
| February | 6,787 | 1,958 | 1,952 | 688 | 116 | 75 |
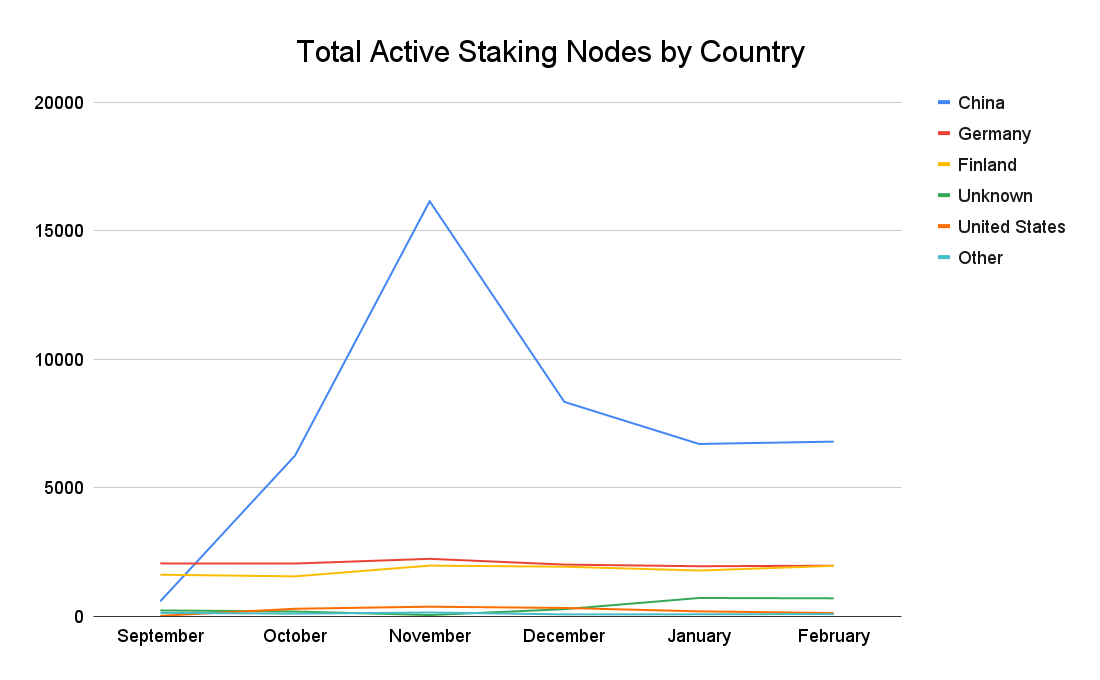
The geographic distribution of active staking nodes in February showed subtle shifts, with slight increases in nodes from China and Germany and a notable increase in nodes from Finland.
Conclusion
February’s metrics underscore a period of continued maturation and adjustment for the Swarm network. While there was a very slight decrease in total monthly rewards, there were increases in median and average win values, along with a rise in the number of winning and active staking nodes. The geographical distribution of nodes continues to highlight the global nature of the Swarm network, emphasizing its appeal across different regions.
Discussions about Swarm can be found on Reddit.
All tech support and other channels have moved to Discord!
Please feel free to reach out via info@ethswarm.org
Join the newsletter! .

