Edit 12/05/24 - active node count, avg earnings, and country counts corrected for October
In this report, we analyze the Swarm network’s performance for October 2024, providing insights into various key metrics including total rewards, win values, node earnings, and geographic distribution. These metrics offer a comprehensive view of the network’s evolution over the month, allowing for a deeper understanding of how the economic and operational mechanisms of Swarm are functioning.
Network Total Monthly Rewards
This metric shows the total rewards paid out across the entire network for each month.
| Month | Total Network Rewards (xBZZ) |
|---|---|
| May | 109,209 |
| June | 112,037 |
| July | 105,855 |
| August | 62,093 |
| September | 99,124 |
| October | 89,250 |
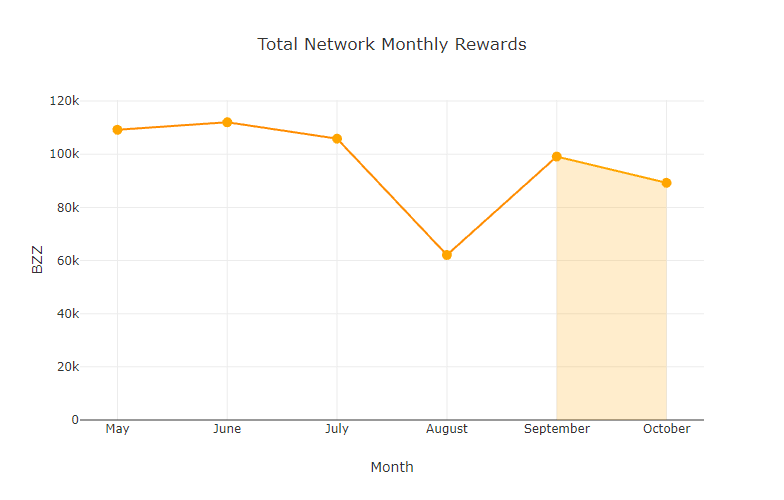
In October, the total network rewards saw a decrease to 89,250 xBZZ from September’s 99,124 xBZZ. This decline follows the rebound observed in September.
Monthly Median Win Values
This metric is the median win amount for each win event, providing insight into the typical reward nodes can expect from a single win event.
| Month | Median Win Values (xBZZ) |
|---|---|
| May | 32.65 |
| June | 33.92 |
| July | 33.67 |
| August | 12.48 |
| September | 30.05 |
| October | 27.70 |
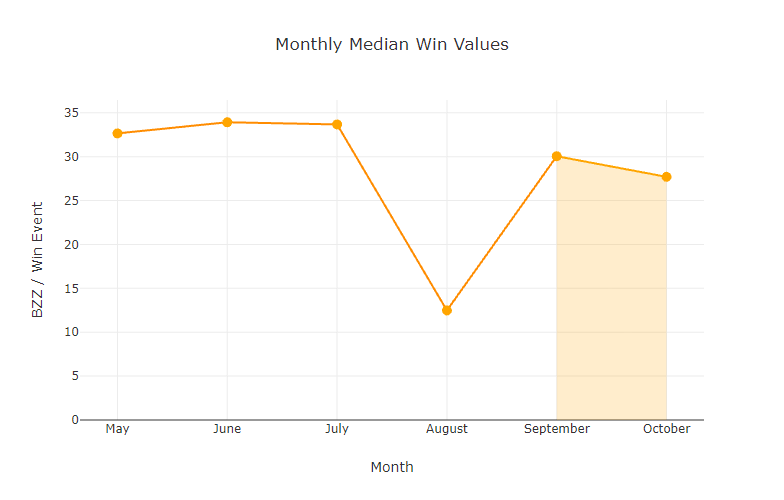
The median win value in October was 27.70 xBZZ, which represents a slight drop from September’s value of 30.05 xBZZ.
Monthly Average Win Values
This metric shows the average win amount for each win event, offering an understanding of how the reward amounts are distributed across the network.
| Month | Average Win Values (xBZZ) |
|---|---|
| May | 36.56 |
| June | 37.07 |
| July | 36.05 |
| August | 19.44 |
| September | 32.58 |
| October | 28.07 |
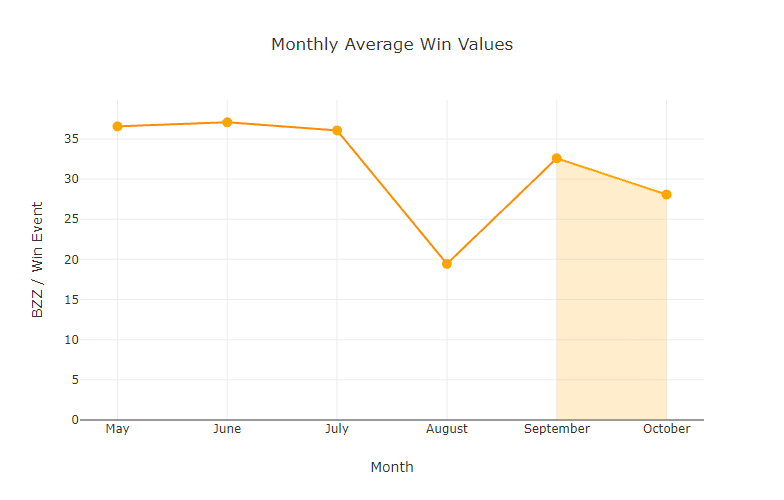
The average win value for October was 28.07 xBZZ, showing a decrease from September’s 32.58 xBZZ. While this is a drop, the value is still higher than the low seen in August, indicating a return to more typical levels after the previous month’s dip.
Active Staking Node Monthly Average Earnings
This metric shows the average monthly earnings for an active staking node, with an “active node” defined as a node that has submitted at least one commit transaction during the month.
| Month | Avg Total Earnings per Node (xBZZ) |
|---|---|
| May | 10.66 |
| June | 9.37 |
| July | 8.22 |
| August | 8.27 |
| September | 17.49 |
| October | 12.17 |
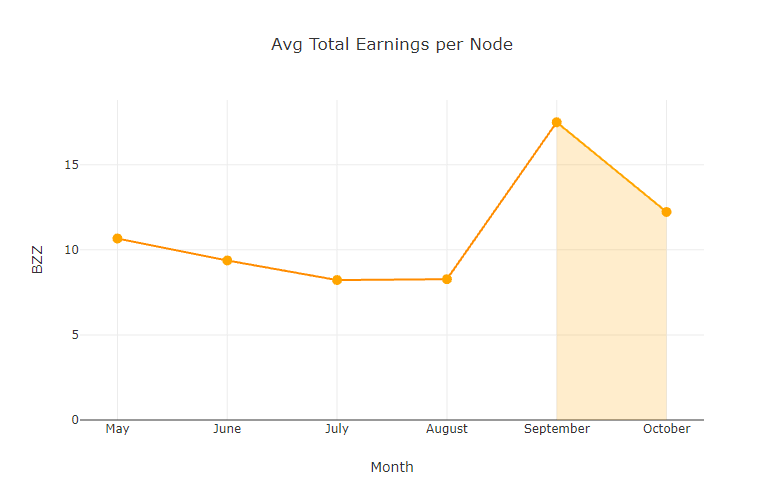
In October, the average earnings per active staking node were 12.22 xBZZ, a decrease from the sharp rise in September (17.49 xBZZ). This suggests that while earnings per node are still relatively high, they have adjusted to reflect the lower total rewards seen in October.
Total Active Staking Nodes by Month
This metric shows the total number of active staking nodes, defined as nodes that have issued at least one commit transaction during the month.
| Month | Total Active Staking Nodes |
|---|---|
| May | 10,245 |
| June | 11,950 |
| July | 12,871 |
| August | 7,506 |
| September | 5,667 |
| October | 7,331 |
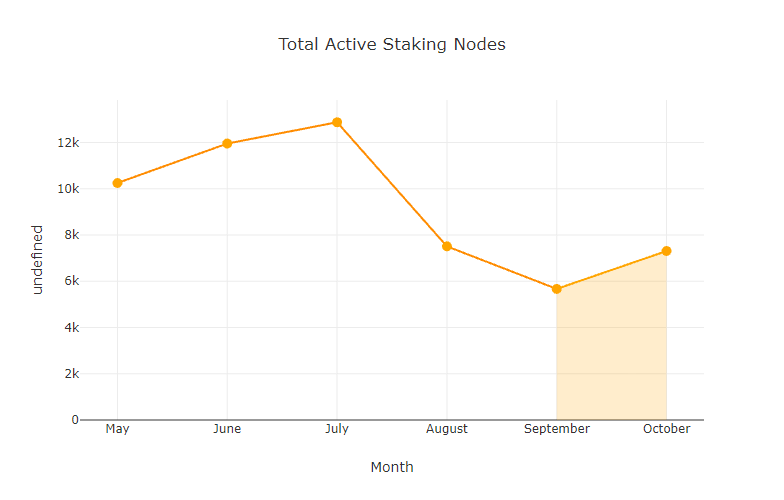
October saw a modest increase in active staking nodes, rising to 7,304 from September’s 5,667.
Total Reachable Full Nodes Regardless of Active Status
This metric counts the total number of unique full nodes that were reachable at any point in the month, providing a broader picture of network activity beyond just active committers.
| Month | Total Reachable Full Nodes |
|---|---|
| May | 16,000 |
| June | 18,916 |
| July | 20,898 |
| August | 24,168 |
| September | 18,589 |
| October | 15,206 |
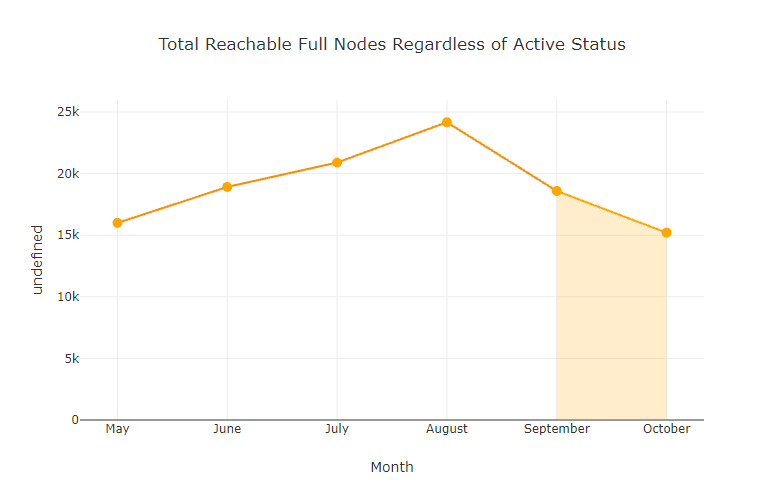
The total number of reachable full nodes decreased in October, dropping to 15,206 from September’s 18,589. This decline continues the trend of fluctuating reachable nodes, likely influenced by the changes in active node participation and network activity.
Total Winning Nodes by Month
This metric tracks the number of unique staking nodes that won the redistribution game at least once during the month.
| Month | Total Winning Nodes |
|---|---|
| May | 2,554 |
| June | 2,680 |
| July | 2,622 |
| August | 2,769 |
| September | 2,379 |
| October | 2,588 |
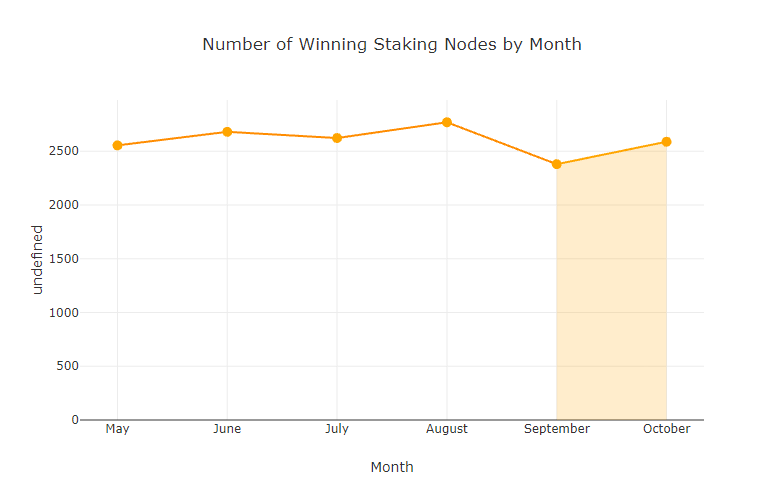
The total number of winning nodes increased in October, rising to 2,588 from September’s 2,379.
Total Active Staking Nodes by Country
This section breaks down active staking nodes by country, providing insights into the global distribution of the network.
| China | Germany | Finland | Unknown | United States | Other | |
|---|---|---|---|---|---|---|
| May | 6,010 | 1,739 | 2,173 | 1,899 | 84 | 69 |
| June | 7,480 | 1,718 | 2,276 | 370 | 79 | 27 |
| July | 8,539 | 1,828 | 2,395 | 1 | 83 | 25 |
| August | 5,406 | 886 | 1,157 | 1 | 40 | 16 |
| September | 3,440 | 655 | 1,503 | 3 | N/A | 66 |
| October | 4,819 | 736 | 1,688 | 10 | 13 | 65 |
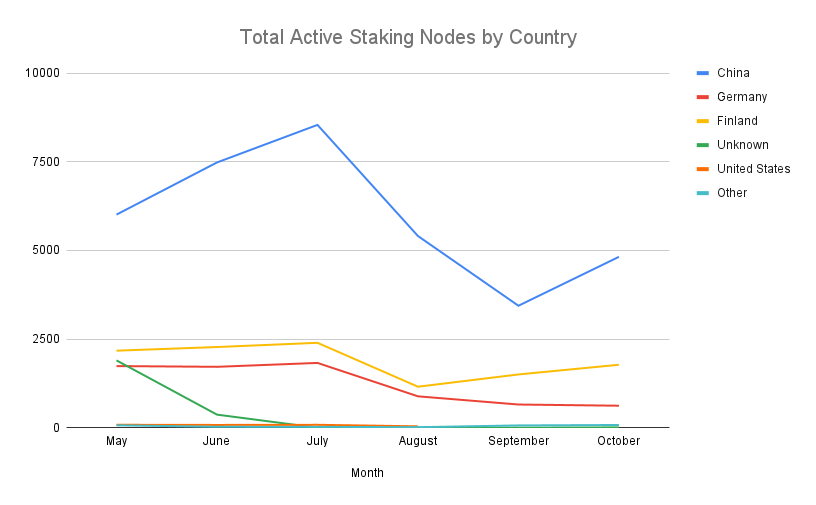
In October, the network saw a significant increase in the number of active staking nodes from China, while Germany saw a minor reduction in node counts and Finland saw a moderate increase. The United States continued to be absent from the top ranks, and countries like Spain and the Netherlands experienced increases in their participation, contributing to the “Other” category.
Conclusion
In October 2024, the Swarm network exhibited adjustments in several key metrics. There was a significant increase in the total number of nodes actively participating in redistribution, despite the slightly lower total rewards payout for the month. Globally, there has been renewed participation in nodes coming from China and Finland, with participation remaining stable in other regions. These trends suggest that the Swarm network’s reward distribution and economic mechanisms are functioning as intended, with nodes adjusting to shifting participation levels and rewards.
Discussions about Swarm can be found on Reddit.
All tech support and other channels have moved to Discord!
Please feel free to reach out via info@ethswarm.org
Join the newsletter! .

