August 2025 State of the Network Report
August brought another month of strong performance for the Swarm network. Total rewards climbed to the highest level seen this year, and both median and average win values continued to rise, further improving payouts for node operators. Active node counts rebounded slightly from July’s sharp decline, though overall network reach dipped as fewer full nodes were online. The most striking change was geographical: China overtook Finland to become the leading hub of active nodes, signaling a significant shift in the network’s distribution.
Network Total Monthly Rewards
This metric shows the total storage incentives rewards paid out across the entire network for each month.
| Month | Total Network Rewards (xBZZ) |
|---|---|
| March | 39,853 |
| April | 24,441 |
| May | 27,851 |
| June | 24,545 |
| July | 37,249 |
| August | 41,496 |
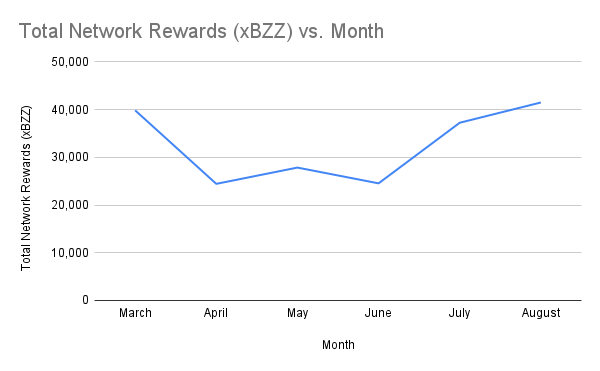
Total network rewards rose from 37,249 xBZZ in July to 41,496 xBZZ in August, a gain of 11.4% and the highest level since March.
Monthly Median Win Values
This metric is the median win amount for each win event, providing insight into the typical reward nodes can expect from a single win event.
| Month | Median Win Values (xBZZ) |
|---|---|
| March | 11.73 |
| April | 7.21 |
| May | 8.12 |
| June | 7.38 |
| July | 10.00 |
| August | 11.07 |
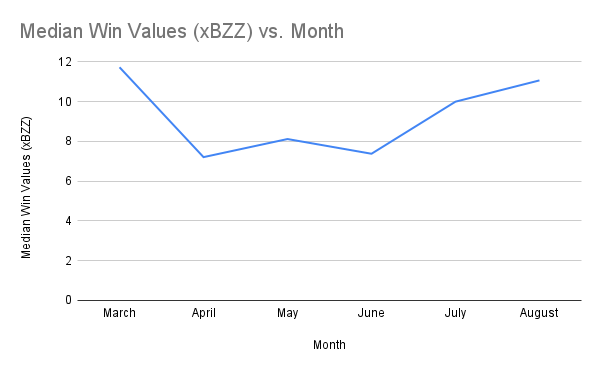
Median win values increased from 10.00 xBZZ in July to 11.07 xBZZ in August, suggesting higher typical payouts per win event.
Monthly Average Win Values
This metric shows the average win amount for each win event, offering an understanding of how the reward amounts are distributed across the network.
| Month | Average Win Values (xBZZ) |
|---|---|
| March | 12.21 |
| April | 7.51 |
| May | 8.24 |
| June | 7.44 |
| July | 11.07 |
| August | 12.28 |
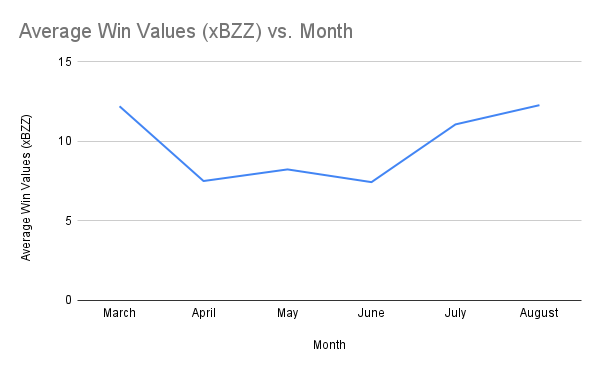
Average win values climbed from 11.07 xBZZ in July to 12.28 xBZZ in August, further increasing overall earnings potential for winning nodes.
Active Staking Node Monthly Average Earnings
This metric shows the average monthly earnings for an active staking node, with an “active node” defined as a node that has submitted at least one commit transaction during the month.
| Month | Avg Total Earnings per Node (xBZZ) |
|---|---|
| March | 7.02 |
| April | 4.88 |
| May | 5.28 |
| June | 4.97 |
| July | 10.79 |
| August | 11.33 |
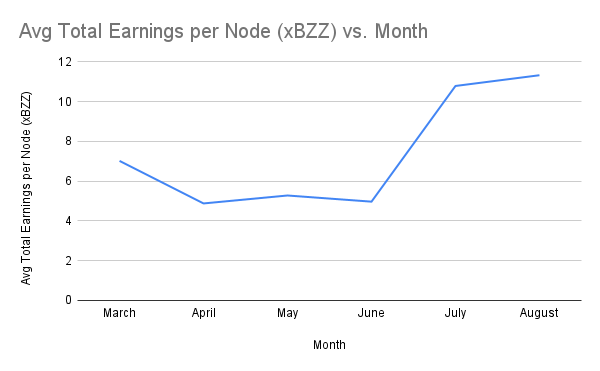
Average earnings per active staking node rose slightly from 10.79 xBZZ in July to 11.33 xBZZ in August, maintaining the strong gains seen the previous month.
Total Active Staking Nodes by Month
This metric shows the total number of active staking nodes, defined as full nodes that have issued at least one commit transaction during the month.
| Month | Total Active Staking Nodes |
|---|---|
| March | 5,676 |
| April | 5,008 |
| May | 5,277 |
| June | 4,934 |
| July | 3,453 |
| August | 3,663 |
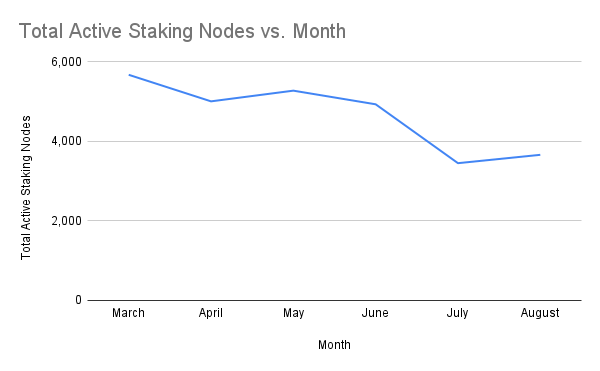
The number of active staking nodes increased from 3,453 in July to 3,663 in August, a rebound of 6.1% after July’s sharp decline.
Total Reachable Full Nodes Regardless of Active Status
This metric counts the total number of unique full nodes (as determined by unique blockchain address) that were reachable at any point in the month, providing a broader picture of network activity beyond just active committers.
| Month | Total Reachable Full Nodes |
|---|---|
| March | 13,481 |
| April | 12,054 |
| May | 9,371 |
| June | 8,473 |
| July | 9,753 |
| August | 7,097 |
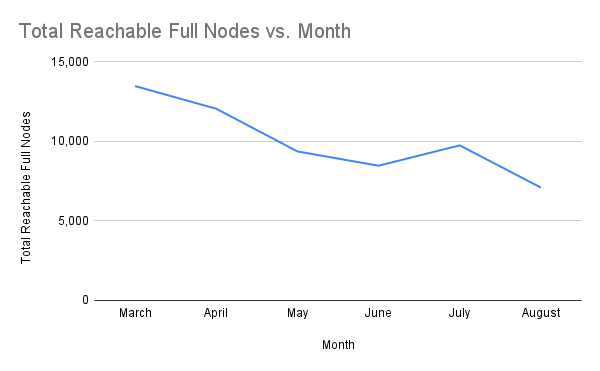
Reachable full nodes dropped from 9,753 in July to 7,097 in August, a decline of 27.2%, pointing to reduced overall network reach.
Total Winning Nodes by Month
This metric tracks the number of unique staking nodes that won the redistribution game at least once during the month.
| Month | Total Winning Nodes |
|---|---|
| March | 2,253 |
| April | 2,197 |
| May | 2,052 |
| June | 2,197 |
| July | 1,806 |
| August | 1,738 |
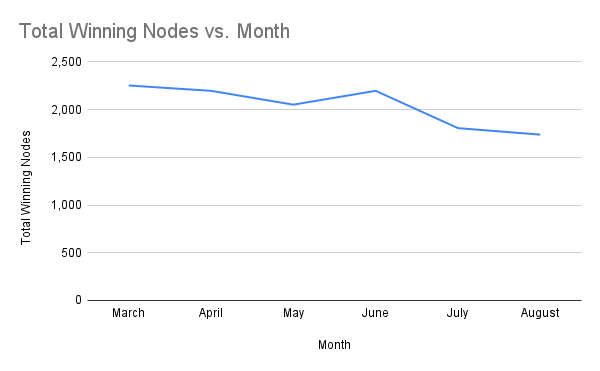
The number of winning nodes fell slightly from 1,806 in July to 1,738 in August, a 3.8% decline.
Total Active Staking Nodes by Country
This metric shows the total number of active staking nodes globally for the month of August, 2025.
| Country | Unique txSenders |
|---|---|
| China | 1,941 |
| Finland | 1,668 |
| Unknown | 33 |
| Hungary | 9 |
| United States | 4 |
| Estonia | 3 |
| Japan | 1 |
| France | 1 |
| Russia | 1 |
| Lithuania | 1 |
| Norway | 1 |
Between July and August 2025, active nodes in China more than doubled (932 → 1,941) while Finland’s active node count dropped sharply (2,239 → 1,668). Many smaller contributor countries from July (Germany, UK, Romania, etc.) disappeared, while August saw a concentration in just a few regions, with China and Finland dominating most of the activity.
Conclusion
In summary, August 2025 set a new high for rewards this year, with both median and average win values strengthening payouts. Active node participation recovered slightly, though overall network reach contracted. The geographic landscape shifted dramatically, China overtook Finland as the largest hub of active staking nodes, while other smaller countries dropped off the list.
Discussions about Swarm can be found on Reddit.
All tech support and other channels have moved to Discord!
Please feel free to reach out via info@ethswarm.org
Join the newsletter! .