July 2025 State of the Network Report
July was a standout month for the Swarm network, delivering the highest increase in rewards we’ve seen in a long time. Total rewards, average payouts, and median wins all climbed sharply — and with fewer nodes actively staking, those who did participate enjoyed significantly larger individual payouts. For node operators, this meant a bigger share of the pie and stronger returns than in previous months. The network’s overall reach also grew, with more full nodes online than last month, strengthening Swarm’s resilience and capacity. Geographically, Finland and China remained strongholds, maintaining their lead in global distribution.
Network Total Monthly Rewards
This metric shows the total storage incentives rewards paid out across the entire network for each month.
| Month | Total Network Rewards (xBZZ) |
|---|---|
| February | 27,350 |
| March | 39,853 |
| April | 24,441 |
| May | 27,851 |
| June | 24,545 |
| July | 37,249 |
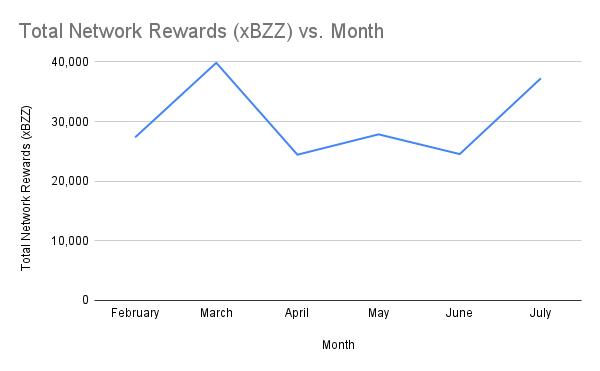
Total network rewards increased sharply from 24,545 xBZZ in June to 37,249 xBZZ in July, a rise of approximately 51.8%.
Monthly Median Win Values
This metric is the median win amount for each win event, providing insight into the typical reward nodes can expect from a single win event.
| Month | Median Win Values (xBZZ) |
|---|---|
| February | 8.54 |
| March | 11.73 |
| April | 7.21 |
| May | 8.12 |
| June | 7.38 |
| July | 10.00 |
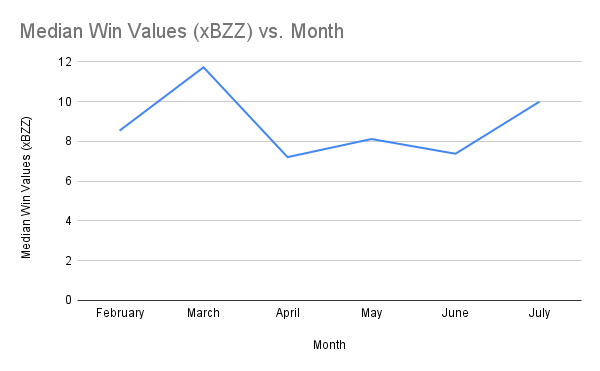
Median win values rose from 7.38 xBZZ in June to 10.00 xBZZ in July, indicating a higher typical payout per win event.
Monthly Average Win Values
This metric shows the average win amount for each win event, offering an understanding of how the reward amounts are distributed across the network.
| Month | Average Win Values (xBZZ) |
|---|---|
| February | 9.39 |
| March | 12.21 |
| April | 7.51 |
| May | 8.24 |
| June | 7.44 |
| July | 11.07 |
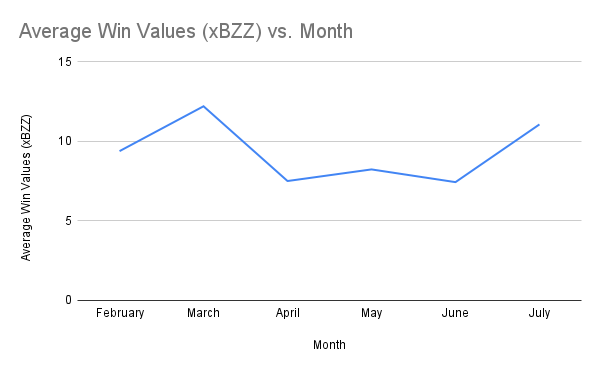
Average win values climbed from 7.44 xBZZ in June to 11.07 xBZZ in July, suggesting an increased reward distribution for winning nodes.
Active Staking Node Monthly Average Earnings
This metric shows the average monthly earnings for an active staking node, with an “active node” defined as a node that has submitted at least one commit transaction during the month.
| Month | Avg Total Earnings per Node (xBZZ) |
|---|---|
| February | 4.19 |
| March | 7.02 |
| April | 4.88 |
| May | 5.28 |
| June | 4.97 |
| July | 10.79 |
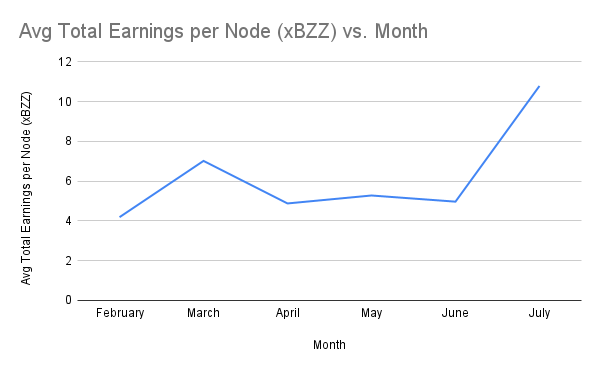
Average earnings per active staking node more than doubled from 4.97 xBZZ in June to 10.79 xBZZ in July.
Total Active Staking Nodes by Month
This metric shows the total number of active staking nodes, defined as full nodes that have issued at least one commit transaction during the month.
| Month | Total Active Staking Nodes |
|---|---|
| February | 6,532 |
| March | 5,676 |
| April | 5,008 |
| May | 5,277 |
| June | 4,934 |
| July | 3,453 |
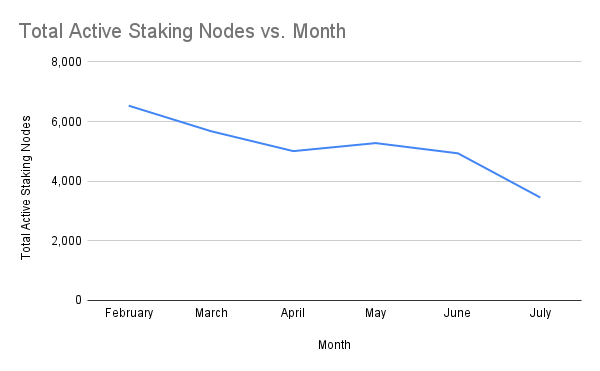
The number of active staking nodes dropped from 4,934 in June to 3,453 in July, a decline of 30%.
Total Reachable Full Nodes Regardless of Active Status
This metric counts the total number of unique full nodes (as determined by unique blockchain address) that were reachable at any point in the month, providing a broader picture of network activity beyond just active committers.
| Month | Total Reachable Full Nodes |
|---|---|
| February | 12,858 |
| March | 13,481 |
| April | 12,054 |
| May | 9,371 |
| June | 8,473 |
| July | 9,753 |
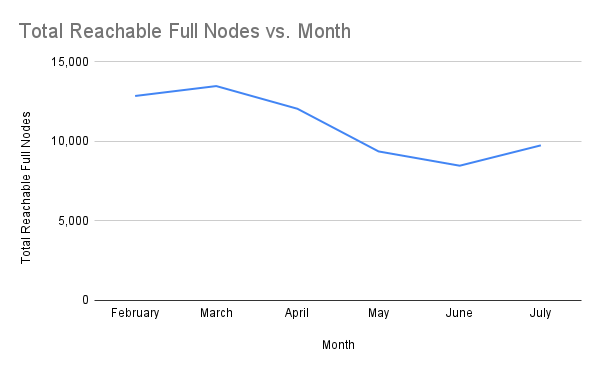
Reachable full nodes increased from 8,473 in June to 9,753 in July, a growth of about 15.1%.
Total Winning Nodes by Month
This metric tracks the number of unique staking nodes that won the redistribution game at least once during the month.
| Month | Total Winning Nodes |
|---|---|
| February | 2,203 |
| March | 2,253 |
| April | 2,197 |
| May | 2,052 |
| June | 2,197 |
| July | 1,806 |
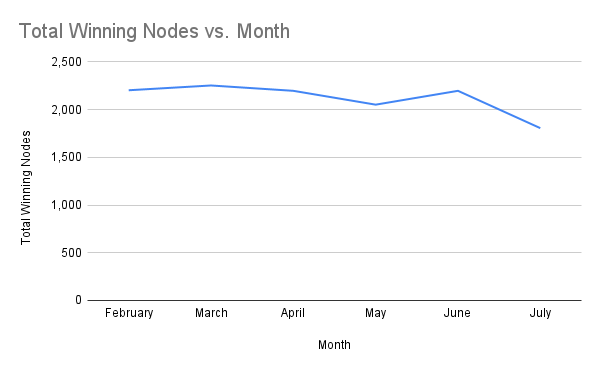
The number of winning nodes fell from 2,197 in June to 1,806 in July, a decrease of 17.8%.
Total Active Staking Nodes by Country
This metric shows the total number of active staking nodes globally for the month of July, 2025.
| Country | Unique txSenders |
|---|---|
| Finland | 2,239 |
| China | 932 |
| Germany | 204 |
| United States | 21 |
| Unknown | 12 |
| The Netherlands | 9 |
| Hungary | 8 |
| United Kingdom | 8 |
| Romania | 3 |
| Slovenia | 3 |
| Estonia | 2 |
| Japan | 2 |
| Ukraine | 2 |
| Russia | 1 |
| Australia | 1 |
| United Arab Emirates | 1 |
| Canada | 1 |
| Brazil | 1 |
| Bulgaria | 1 |
| Hong Kong | 1 |
| Vietnam | 1 |
Finland and China remained the top two countries by active node count, with Finland further widening its lead in July.
Conclusion
In summary, July 2025 saw rewards climb sharply, with total, median, and average win values all up — boosted in part by a drop in active staking nodes that left larger shares for those remaining. Reachable full nodes grew, strengthening network capacity, while Finland and China continued to dominate global distribution.
Discussions about Swarm can be found on Reddit.
All tech support and other channels have moved to Discord!
Please feel free to reach out via info@ethswarm.org
Join the newsletter! .