June 2025 State of the Network Report
The June 2025 edition of the State of the Network report presents an overview of key activity and performance metrics across the Swarm network. These figures provide insight into node participation, reward distribution, and geographic activity throughout the month.
Network Total Monthly Rewards
This metric shows the total storage incentives rewards paid out across the entire network for each month.
| Month | Total Network Rewards (xBZZ) |
|---|---|
| January | 29,976 |
| February | 27,350 |
| March | 39,853 |
| April | 24,441 |
| May | 27,851 |
| June | 24,545 |
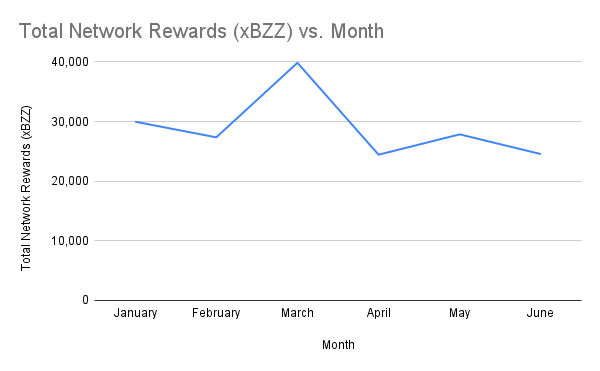
Total network rewards decreased from 27,851 xBZZ in May to 24,545 xBZZ in June, a drop of approximately 11.9%.
Monthly Median Win Values
This metric is the median win amount for each win event, providing insight into the typical reward nodes can expect from a single win event.
| Month | Median Win Values (xBZZ) |
|---|---|
| January | 8.48 |
| February | 8.54 |
| March | 11.73 |
| April | 7.21 |
| May | 8.12 |
| June | 7.38 |
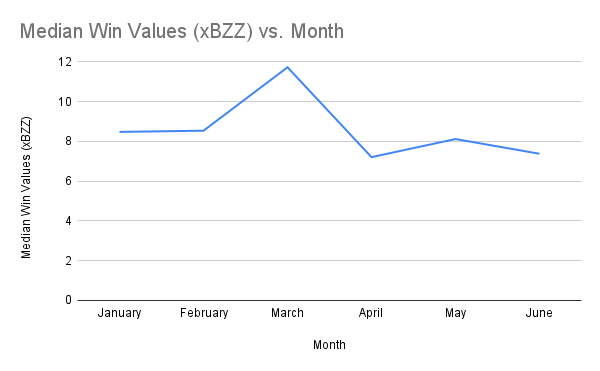
The median win value declined slightly from 8.12 xBZZ in May to 7.38 xBZZ in June.
Monthly Average Win Values
This metric shows the average win amount for each win event, offering an understanding of how the reward amounts are distributed across the network.
| Month | Average Win Values (xBZZ) |
|---|---|
| January | 9.13 |
| February | 9.39 |
| March | 12.21 |
| April | 7.51 |
| May | 8.24 |
| June | 7.44 |
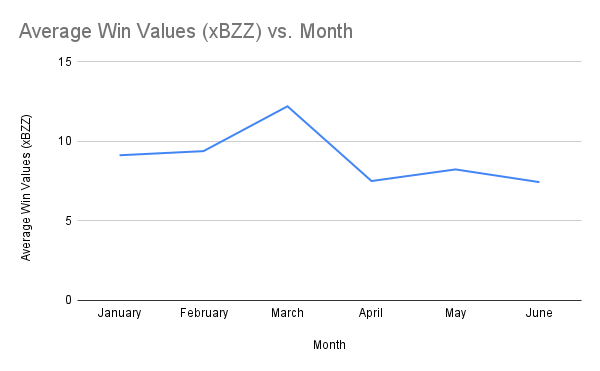
Average win values saw a small decrease from 8.24 xBZZ in May to 7.44 xBZZ in June.
Active Staking Node Monthly Average Earnings
This metric shows the average monthly earnings for an active staking node, with an “active node” defined as a node that has submitted at least one commit transaction during the month.
| Month | Avg Total Earnings per Node (xBZZ) |
|---|---|
| January | 4.10 |
| February | 4.19 |
| March | 7.02 |
| April | 4.88 |
| May | 5.28 |
| June | 4.97 |
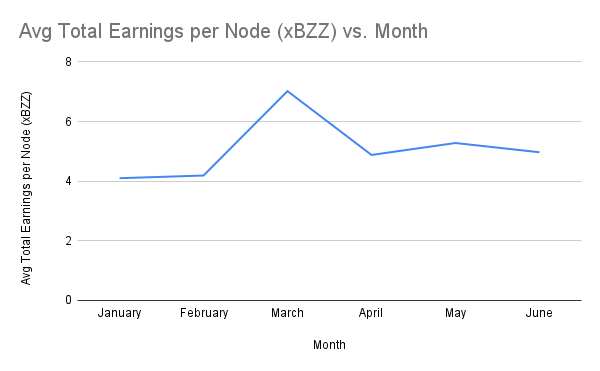
Average earnings per active staking node fell from 5.28 xBZZ in May to 4.97 xBZZ in June.
Total Active Staking Nodes by Month
This metric shows the total number of active staking nodes, defined as full nodes that have issued at least one commit transaction during the month.
| Month | Total Active Staking Nodes |
|---|---|
| January | 7,315 |
| February | 6,532 |
| March | 5,676 |
| April | 5,008 |
| May | 5,277 |
| June | 4,934 |
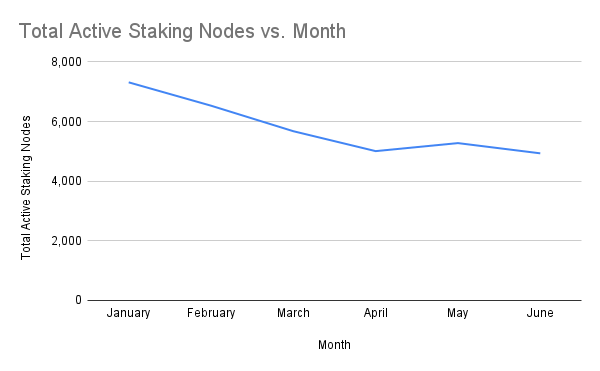
The number of active staking nodes decreased from 5,277 in May to 4,934 in June, a decline of 6.5%.
Total Reachable Full Nodes Regardless of Active Status
This metric counts the total number of unique full nodes (as determined by unique blockchain address) that were reachable at any point in the month, providing a broader picture of network activity beyond just active committers.
| Month | Total Reachable Full Nodes |
|---|---|
| January | 12,240 |
| February | 12,858 |
| March | 13,481 |
| April | 12,054 |
| May | 9,371 |
| June | 8,473 |
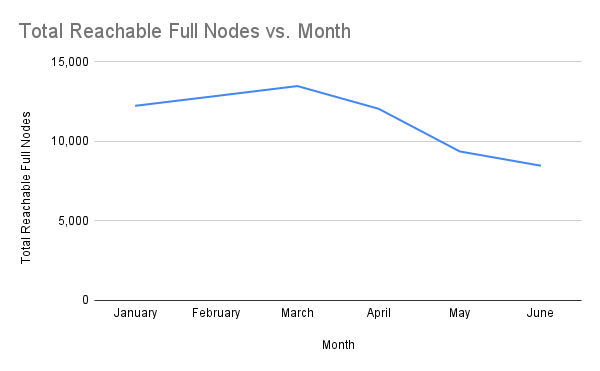
Reachable full nodes declined from 9,371 in May to 8,473 in June, a reduction of about 9.6%.
Total Winning Nodes by Month
This metric tracks the number of unique staking nodes that won the redistribution game at least once during the month.
| Month | Total Winning Nodes |
|---|---|
| January | 2,547 |
| February | 2,203 |
| March | 2,253 |
| April | 2,197 |
| May | 2,052 |
| June | 2,197 |
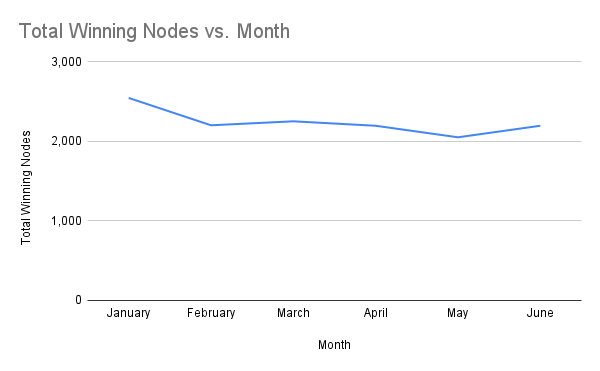
The number of winning nodes increased slightly from 2,052 in May to 2,197 in June.
Total Active Staking Nodes by Country
This metric shows the total number of active staking nodes globally for the month of June, 2025.
| Country | Unique txSenders |
|---|---|
| China | 2461 |
| Finland | 1996 |
| Germany | 328 |
| United Kingdom | 43 |
| United States | 27 |
| Unknown | 13 |
| Australia | 12 |
| Canada | 12 |
| Vietnam | 7 |
| Hungary | 5 |
| Slovenia | 4 |
| Ukraine | 3 |
| Estonia | 3 |
| Bulgaria | 2 |
| Japan | 2 |
| Romania | 2 |
| Mexico | 2 |
| Russia | 1 |
| Greece | 1 |
| Malaysia | 1 |
| Spain | 1 |
| Kenya | 1 |
| India | 1 |
| Colombia | 1 |
| Brazil | 1 |
| Norway | 1 |
| The Netherlands | 1 |
| Mauritius | 1 |
| El Salvador | 1 |
China and Finland continued to dominate in node count, with the top country totals remaining stable month-over-month.
Conclusion
June 2025 saw a slight decrease in overall network activity, with a reduction in total reachable nodes and total rewards distributed compared to the previous month. However, key participation metrics—including the number of winning nodes and active committers—remained relatively stable. The geographic distribution of active nodes continues to be concentrated in a few key regions, notably China and Finland.
Discussions about Swarm can be found on Reddit.
All tech support and other channels have moved to Discord!
Please feel free to reach out via info@ethswarm.org
Join the newsletter! .