
March 2025 State of the Network Report
March data shows a notable change in network metrics, with total-network rewards increasing significantly compared to February, marking the first such increase in the last several months. This shift occurs alongside a continued decrease in active staking nodes. The combination of increased total rewards and fewer active nodes has resulted in significantly higher per-node rewards this month compared to recent months.
Network Total Monthly Rewards
This metric shows the total storage incentives rewards paid out across the entire network for each month.
| Month | Total Network Rewards (xBZZ) |
|---|---|
| October | 89,250 |
| November | 54,053 |
| December | 36,521 |
| January | 29,976 |
| February | 27,350 |
| March | 39,853 |
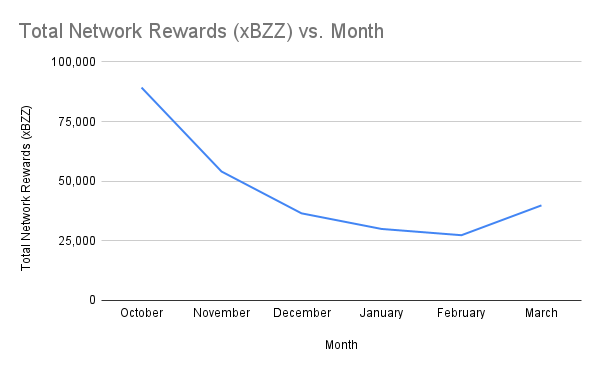
Total network rewards increased to 39,853 xBZZ, up from February’s 27,350 xBZZ. This is the first significant increase after five consecutive months of declining rewards.
Monthly Median Win Values
This metric is the median win amount for each win event, providing insight into the typical reward nodes can expect from a single win event.
| Month | Median Win Values (xBZZ) |
|---|---|
| October | 27.70 |
| November | 17.44 |
| December | 9.93 |
| January | 8.48 |
| February | 8.54 |
| March | 11.73 |
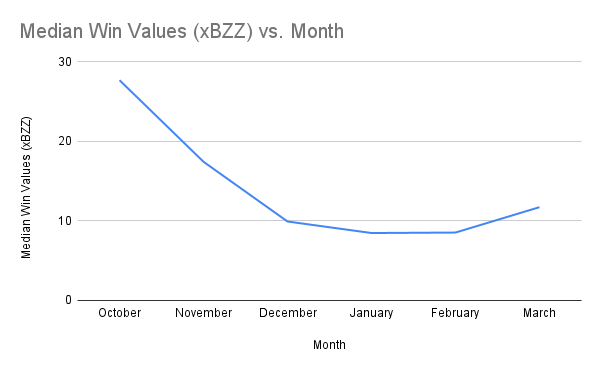
Median win values increased to 11.73 xBZZ, up from February’s 8.54 xBZZ.
Monthly Average Win Values
This metric shows the average win amount for each win event, offering an understanding of how the reward amounts are distributed across the network.
| Month | Average Win Values (xBZZ) |
|---|---|
| October | 28.07 |
| November | 17.13 |
| December | 11.15 |
| January | 9.13 |
| February | 9.39 |
| March | 12.21 |
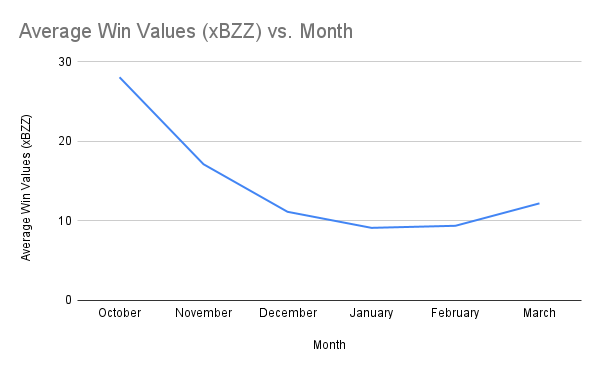
Average win values rose to 12.21 xBZZ, a significant increase from February’s 9.39 xBZZ.
Active Staking Node Monthly Average Earnings
This metric shows the average monthly earnings for an active staking node, with an “active node” defined as a node that has submitted at least one commit transaction during the month.
| Month | Avg Total Earnings per Node (xBZZ) |
|---|---|
| October | 12.22 |
| November | 6.90 |
| December | 4.69 |
| January | 4.10 |
| February | 4.19 |
| March | 7.02 |
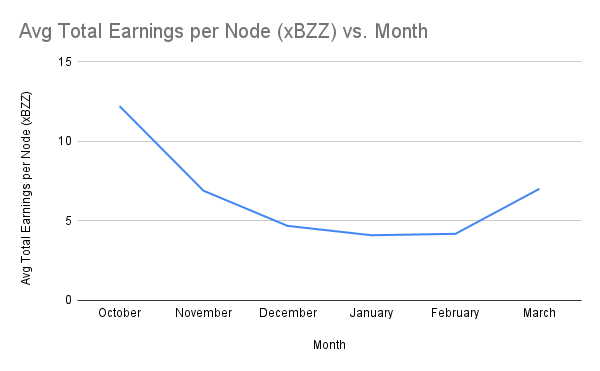
The average earnings per active staking node increased to 7.02 xBZZ, a large increase from the previous month’s average of 4.19 xBZZ.
Total Active Staking Nodes by Month
This metric shows the total number of active staking nodes, defined as nodes that have issued at least one commit transaction during the month.
| Month | Total Active Staking Nodes |
|---|---|
| October | 7,304 |
| November | 7,830 |
| December | 7,793 |
| January | 7,315 |
| February | 6,532 |
| March | 5,676 |
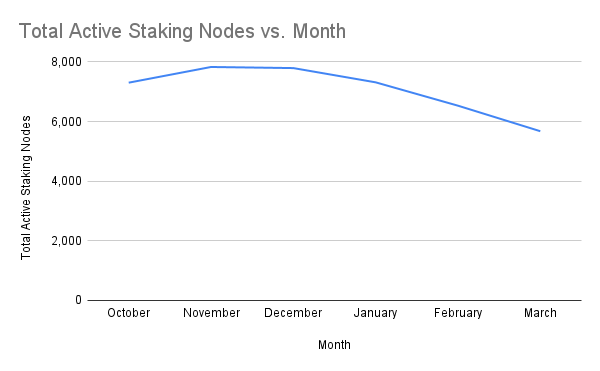
The number of active staking nodes declined to 5,676, a decline from February’s total of 6,532. This continues the downward trend observed since December.
Total Reachable Full Nodes Regardless of Active Status
This metric counts the total number of unique full nodes (as determined by unique blockchain address) that were reachable at any point in the month, providing a broader picture of network activity beyond just active committers.
| Month | Total Reachable Full Nodes |
|---|---|
| October | 15,206 |
| November | 14,075 |
| December | 15,007 |
| January | 12,240 |
| February | 12,858 |
| March | 13,481 |
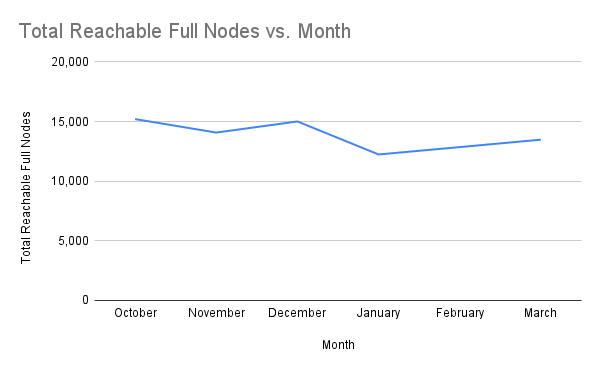
Total reachable full nodes increased to 13,481, increasing from February’s 12,858. This growth occurred while active staking nodes decreased, indicating that there is a significant population of full nodes which are not actively participating in the redistribution game.
Total Winning Nodes by Month
This metric tracks the number of unique staking nodes that won the redistribution game at least once during the month.
| Month | Total Winning Nodes |
|---|---|
| October | 2,588 |
| November | 2,588 |
| December | 2,611 |
| January | 2,547 |
| February | 2,203 |
| March | 2,253 |
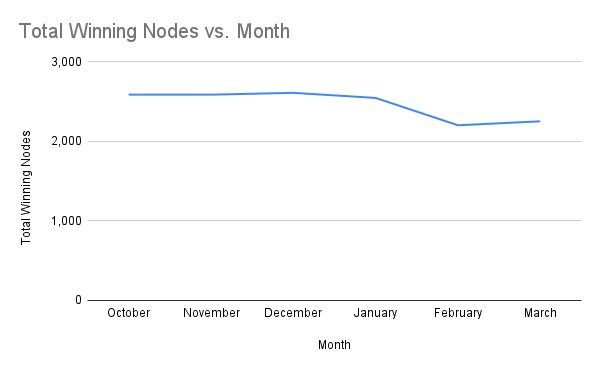
The number of winning nodes increased slightly to 2,253, up slightly from February’s 2,203.
Total Active Staking Nodes by Country
This metric shows the total number of active staking nodes across the top four countries and all other countries aggregated into the “Other” category, as well as the remaining nodes in the “Unknown” category.
| Country | Unique Nodes |
|---|---|
| China | 2576 |
| Finland | 2547 |
| Germany | 497 |
| The Netherlands | 18 |
| Unknown | 11 |
| Canada | 7 |
| United States | 6 |
| Estonia | 3 |
| United Kingdom | 2 |
| Slovenia | 2 |
| Ukraine | 1 |
| Japan | 1 |
| Mexico | 1 |
| France | 1 |
| Switzerland | 1 |
| Spain | 1 |
| Hungary | 1 |
While there have been minor shifts, there have been no changes in the major trends of node distribution by country since the previous month.
Conclusion
March data shows a shift in network metrics, with significant increases in rewards and fewer active staking nodes. Total rewards increased by 45.7% while active nodes decreased by 13.1%, resulting in higher earnings per node, which rose by 67.5%.
The total reachable nodes grew by 4.8% while active staking nodes continued to decrease. Both median and average win values increased substantially in March compared to February.
Geographic distribution remains concentrated primarily in China and Finland, with these countries hosting the majority of active nodes.
Discussions about Swarm can be found on Reddit.
All tech support and other channels have moved to Discord!
Please feel free to reach out via info@ethswarm.org
Join the newsletter! .